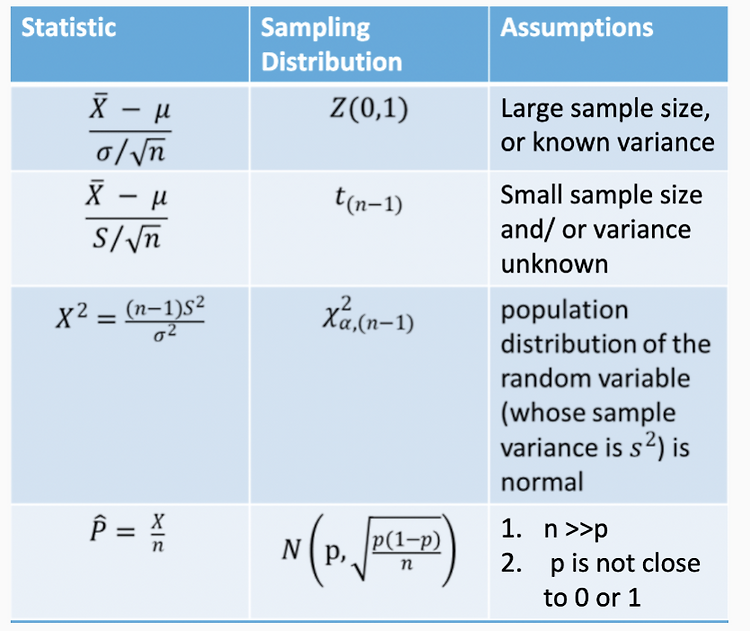
Confidence Intervals란?
Confidence Intervals 신뢰구간은 모수가 실제로 포함되는 것으로 예측되는 범위이다.
전체를 연구하는 것은 어렵기 때문에 샘플링하여 모수 범위를 추정할때 신뢰구간을 사용한다.

Standard Deviation : 20mm
Mean : 175mm
10 bottles of the new Shampoo

파란 부분 : Critical Region
Acceptable Region : Critical Region을 제외한 부분 162.6 < X < 187.4 (95%)
Mean > 175, Mu < 175
a = P(X < 162.6, mu = 175) + P(X > 187.4, mu = 175) = 0.025 + 0.025 = 0.05%
5%의 임의 샘플들은 Null hypothesis 추출을 일으킬 수 있다.

2가지 에러 존재,

Hypothesis :
Null Hypothesis :
Alternate Hypothesis :

A : Correct
B : Incorrect
C : Incorrect
D : Correct : H1, P > 0.1
E : Incorrect
Hypothesis Testing 가설 검정이란?

예제
mu : 175mm
H1 : mu > 175mm
n = 10


Critical region > 185 = P(X > 185 | mu = 175)


가설 검정 과정
1. 변수 정하기
2. 귀무가설 설정 H0
3. 대체가설 선택 H1
4. 대략적인 검정통계 결정
5. 귀무가설에 대한 기각 criteria 설정
6. 필요한 샘플 갯수 계산
7. 결정, H0 기각 혹은 H0 기각 실패
예제

a.
Sample mean = 40.5
(H0) mu = 40, (H1) mu > 40
Z0 = (40.5 - 40) / ( sigma[1.25] / sqrt(n) )
Alpha = 0.05
Z0 > Zc (Zc 는 임계 영역 Critical Region의 시작 값)
Z0 = 1.265, Z1 = 1.645 이기 때문에, Z0 < Z0가 되며 귀무가설은 기각된다.

b.
P-value in part(a) = 0.1029516

c.
Variance 를 아는 경우 Mean에서 검증

1종 요류 확률 : 알파가 분석에 의해 선택
2종 오류 확률 : 베타는 샘플 크기에따라 좌우된다.

예제

a) 41 hours?

b)

-2 부터 -1까지는 Lower Value, -1부터 1까지 점들이 직선에 붙어있는 경우 Higher Value, 1 부터 2까지도 Lower Value


예제
Expect 값은 Binomial Distribution 에서 얻는다.


H0 : The two variables are independent
H1 : The two variavles are not independent

Two Sample
E = Mu1 - Mu2
V = sigma1^2/n + sigma2^ 2/n, ( (x1 - x2) - (mu1 - mu2) ) / ( sigma1 / sqrt(n) + sigma2 / sqrt(n) )
> 2Samplte test


People 6 weeks before and after joining the study
The avearage increase in category fluency
Difference = 1.07
Standard deviation = 3.195
The mean number of words recalled was positive
One-sided test
H0 alpha = 0
H1 alpha > 0
1.07


'AI Master Degree > Math Foundations for Decision and DS' 카테고리의 다른 글
| Analysis of Variance (0) | 2021.10.29 |
|---|---|
| OpenGL is not available in this build in R studio 에러 발생 (0) | 2021.09.12 |
| Project Proposal 1 - Food World Cup (0) | 2021.09.09 |
